
RemarkableCloud Customer Satisfaction 2024
2024 Annual Survey 5 min read RemarkableCloud Team
RemarkableCloud customer satisfaction 2024
Every year we survey customers across ten dimensions of their experience. The questions cover what actually matters: is the server fast, is support responsive, does email work, is the price fair. No leading questions, no cherry-picked samples.
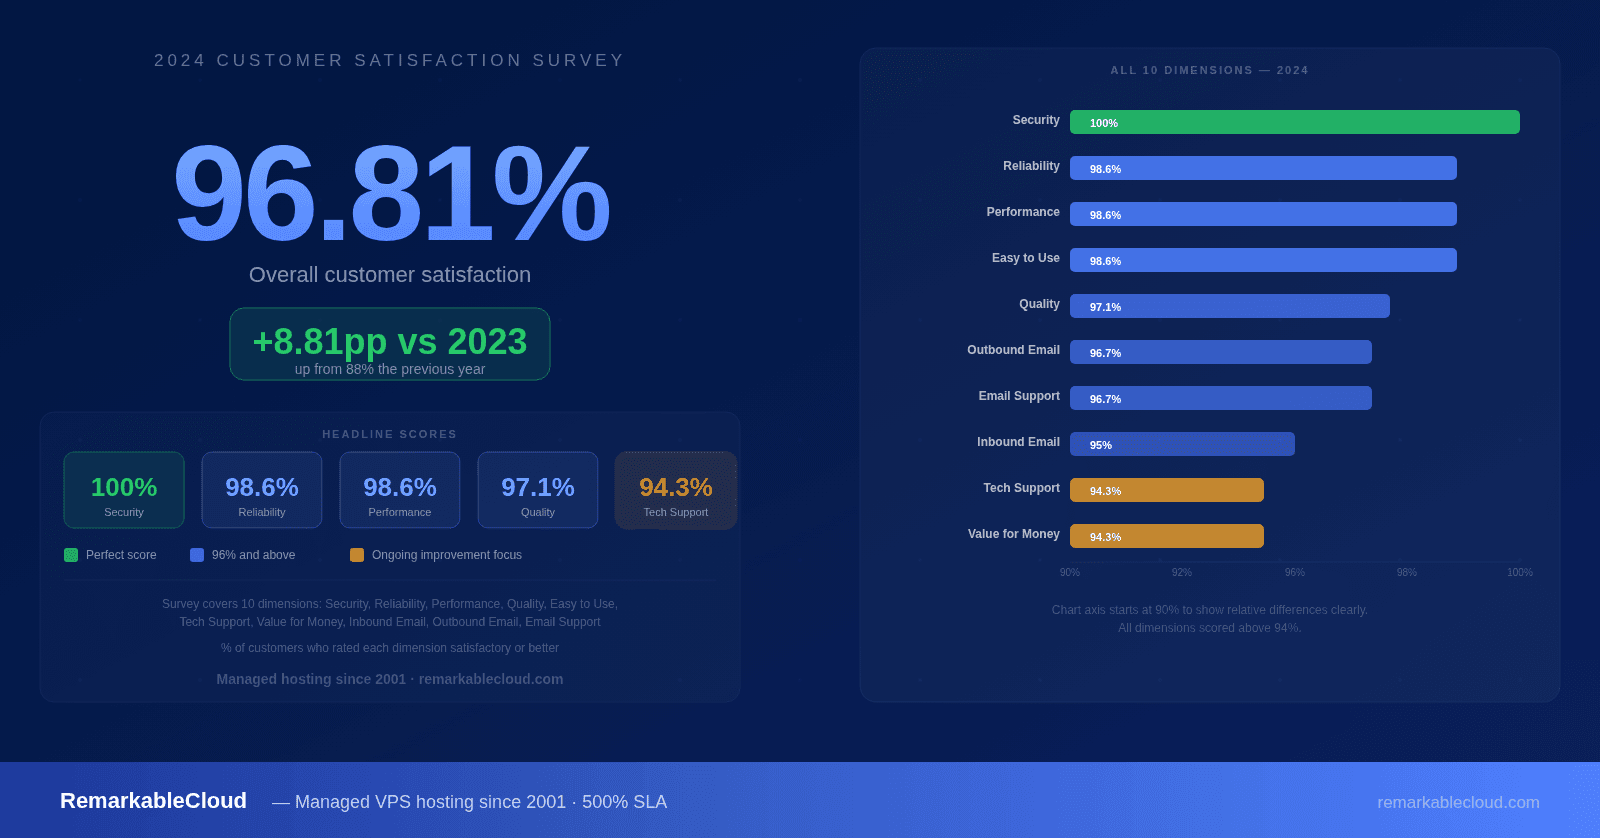
In 2024, 96.81% of respondents rated their overall experience as satisfactory or better. Here’s what the data shows, how it compares to 2023, and what we changed to get there.
96.81%
Overall customer satisfaction
Across all ten service dimensions in the 2024 annual survey.
Up from 88% in 2023, an improvement of 8.81 percentage points.
+8.81pp
year on year
improvement
Results by service dimension
Security received a perfect 100% score: the only dimension to do so. Reliability, Performance, and Ease of Use all reached 98.6%. Tech Support and Value for Money came in at 94.3%, the two areas we have continued investing in through 2024 and into 2025.
Satisfaction score by dimension: 2024
100%
Security
98.6%
Reliability
98.6%
Performance
98.6%
Easy to Use
97.1%
Quality
96.7%
Outbound Email
96.7%
Email Support
95%
Inbound Email
94.3%
Tech Support
94.3%
Value for Money
Year on year: from 88% to 96.81%
The 8.81 percentage point improvement is not from a single initiative. It came from parallel work across five areas that each moved the needle independently.
2023
88%
→ +8.81pp
2024
96.81%
⚡
User experience
Usability testing, dashboard overhauls, and streamlined onboarding reduced friction across RemarkablePanel and the client portal. Fewer steps, clearer feedback, less confusion.
🖥
Infrastructure reliability
Advanced load balancing and architectural improvements pushed Reliability and Performance to 98.6%. The 2023 infrastructure was already above industry averages; 2024 closed the remaining gap.
🔒
Security standards
Proactive security monitoring, stricter quality processes, and enhanced compliance practices contributed to Security reaching a perfect 100% score: the highest-rated dimension in the survey.
🎯
Support capability
Technical training investment, expanded knowledge bases, and better escalation paths gave the support team the tools to resolve complex issues faster. Tech Support reached 94.3% and continues to be a priority area.
💰
Value for money
Transparent pricing, the introduction of multi-year prepay discounts, and the RemarkablePanel free license policy improved perceived value. Value for Money at 94.3% reflects customers recognizing what’s included.
📧
Email services
MailChannels SMTP integration and Rspamd gateway improvements pushed outbound email satisfaction to 96.7%. Inbound email and email support followed, both benefiting from the same infrastructure investment.
Why we run this survey
Customer satisfaction data does three things for us: it identifies where we’re falling short before those gaps become churn, it gives the team specific targets to improve against, and it provides prospective customers with honest evidence of what working with us is like.
The ten dimensions were chosen because they map directly to what hosting customers actually care about. A hosting provider can have a high overall satisfaction score while quietly underperforming on email delivery or security: dimensions that matter enormously to the customers who depend on them. Breaking the score down dimension by dimension prevents that kind of masked underperformance.
Tech Support and Value for Money sitting at 94.3% are not failures: they’re the dimensions we pay most attention to. Every improvement cycle starts from the lowest scores, not the highest.